Problems with the calculation of PR/Performance Ratio

Calculating the Performance Ratio (PR) is an essential tool for evaluating and measuring the efficiency of a photovoltaic plant. The PR provides an objective metric to determine how a solar energy installation performs compared to its theoretical potential. This indicator is widely used in the solar industry to assess a plant's performance and optimize its operation.
The Performance Ratio (PR) is usually a key requirement during the PAC, IAC, and FAC phases (pre-acceptance test, final acceptance test, and final acceptance certificate) due to the valuable information it provides regarding the installation's quality and the estimation of the power it will generate over its lifetime. Contractually, guaranteed values are established that the plant must meet in each phase. These values are determined based on target PR values provided by theoretical simulations carried out with PVSYST software, which will be accepted by the parties and included as part of the contract.
IEC 61724, issued by the International Electrotechnical Commission (IEC), establishes the foundations for calculating the PR and serves as a fundamental reference in this task, as well as in defining recommended monitoring equipment for each installation based on system size.
In this article, we will briefly analyze the main challenges that arise when calculating the PR of a photovoltaic plant and the best practices to effectively address them.
Contractual definition of the calculation procedure
One of the main problems encountered when evaluating the PR is the lack of definition of the calculation procedure in the contract between the owner and the main contractor.
Properly defining the calculation methodology in the EPC contract constitutes a solid basis for measuring and verifying the performance of the photovoltaic plant. It provides transparency, clarity, and confidence between the owner and the main contractor, facilitating effective monitoring and maintenance of the plant. It is important to establish appropriate calculation and data filtering criteria so that the test is as close to reality as possible and can be faithfully compared with the theoretical potential of the simulation.
It is recommended to define, at a minimum, the following points in the EPC contract: PVSYST simulation, detailed PR calculation procedure, data filtering criteria, calculation requirements, minimum monitoring equipment and their characteristics, and guaranteed and minimum PR values.
To define these criteria, broad knowledge of calculation and the sector is required. Photovoltaic technology advances rapidly, and it is increasingly advisable to have a technical advisor with updated knowledge of market standards.
Proper simulation using PVSYST software
The PR compares the installation's performance with its theoretical potential (simulation), making the quality of the simulation crucial. When performing the simulation with PVSYST, numerous factors and parameters must be considered, including meteorological data (solar radiation, ambient temperature), photovoltaic system characteristics, losses, shading effects, solar panel degradation, or inverter efficiency, among others. Correctly considering these aspects is fundamental to obtain an accurate assessment of the performance and theoretical potential of the plant.
Estimating energy production allows for evaluating expected income, return on investment times, and other key financial indicators. Hence, it is essential for making decisions about the project's viability and profitability. The technical advisor not only verifies the simulation but can also offer recommendations and strategies to optimize the photovoltaic plant's performance by suggesting improvements in the system configuration to maximize energy generation.
Interpretation and application of the standard
IEC 61724 provides the guidelines and standard procedures for calculating the PR. It is divided into three main points:
- Measurement: This includes measuring key variables such as generated energy, incident solar radiation, module temperature, and other relevant parameters.
- Calibration and maintenance procedures: This ensures that the collected data is reliable and accurate over time.
- Data presentation: The standard defines report formats and elements that should be included in data presentation, facilitating the understanding and evaluation of system efficiency.
Applying the standard correctly requires an in-depth understanding of its technical aspects and the considerations specific to each case. This depends on factors such as the design criteria of the photovoltaic plant, characteristics of the main equipment, measurement devices, inputs taken from the SCADA monitoring system, and even specific meteorological considerations during the test or at the determined location. To compare the obtained performance with the guaranteed performance, the focus should be on the system-level data and the coherence of prediction and test methods. A qualified technical advisor will ensure the appropriate application of the established requirements.
Data collection and filtering
Another challenge in calculating the PR is analyzing the coherence and validity of the data. Often, deviations, errors in data records, zeros, accumulated values, discrepancies in units of measurement, and various inconsistencies are found, requiring a detailed analysis and expertise. If not detected, these issues can seriously disrupt the calculation.
By using different data filters and calculation considerations, the goal is to obtain a precise calculation that truthfully reflects the operation of the installation to be compared with the values provided by the simulation.
As mentioned in the first point, it is recommended to include a PR calculation procedure in the EPC contract to ensure clarity about the expectations and agreed criteria between the owner and the main contractor. This helps avoid misunderstandings and subsequent disputes.
Graphs
One of the most effective tools for understanding and analyzing calculation parameters is the use of graphs representing their behavior. Graphs not only do not pose a problem for the PR calculation but are also our best allies when detecting flaws in the plant's operation, measurement records, or in our own calculation. They are a convenient and visual resource that allows us to efficiently evaluate a large volume of data. That's why they deserve to be mentioned in this article.
By comparing different technical inputs and applying our experience, we can detect inconsistencies, errors in measurement equipment calibration, anomalies in inverters, incorrect operation of solar trackers, losses due to heating, as well as effectively analyzing coherence in production values (at the system and inverter levels), inverter efficiency, solar tracker gain, and equipment availability, among others.
The proper detection of deviations is crucial for improving the design and operation of the plant and maximizing its performance.
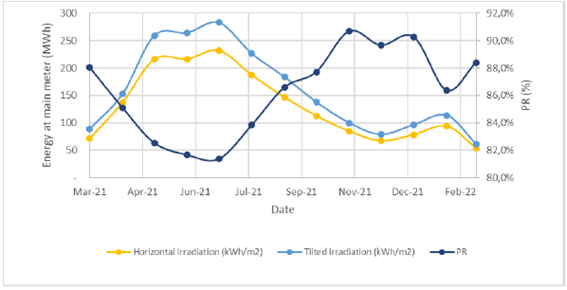 Comparison of PR, GHI and GPOA (Calculation of PR in IAC)
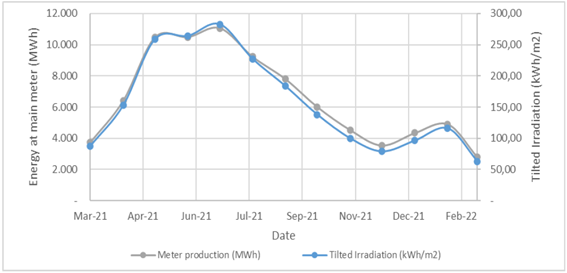 Comparison of Production (MWh) and GPOA (kWh/m2)
 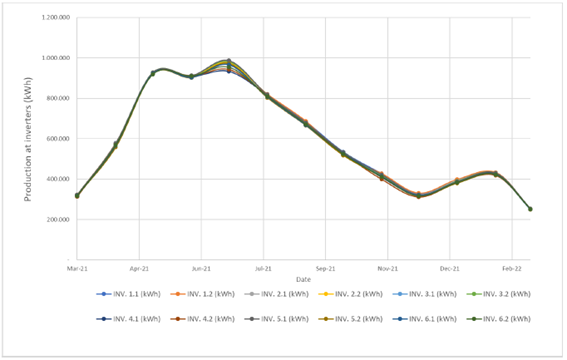 Comparison of PR, GHI and GPOA (Calculation of PR in IAC)
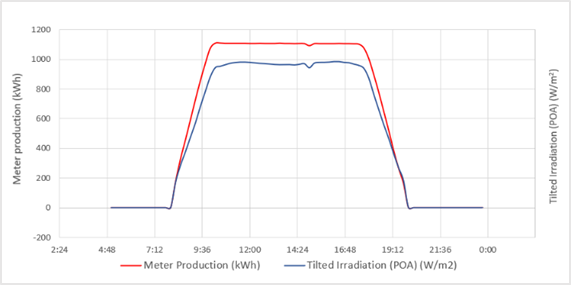 Vector Renewables performs detailed analysis to verify the epecist's PR calculation, ensuring that it is done in accordance with regulations, contract and best practice, and can guarantee that the agreed output set out in the property's financial model is achieved.
Stay Informed
When you subscribe to the blog, we will send you an e-mail when there are new updates on the site so you wouldn't miss them.